
Introduction
Pictograms, the visual symbols that encapsulate ideas, concepts, or stories, are integral to our daily communication. These symbols are crafted to express intricate ideas in an uncomplicated manner, thus serving as a powerful tool to overcome language barriers and foster comprehension among diverse cultures and nationalities.
The lineage of pictograms traces back to ancient civilizations, and their usage persists in non-literate cultures even today. In the contemporary world, pictograms have found their niche from public signage to the Olympics, evolving into a universal language that surpasses linguistic confines.
In design, pictograms adhere to certain stylistic norms to ensure visual uniformity. They are typically designed on a grid to maintain consistent positioning and proportions, with an emphasis on simplicity and clarity. The use of perspective is generally eschewed, and the shapes and lines employed are meticulously selected to effectively convey the intended meaning.
This blog will delve into the intriguing world of pictograms, exploring their significance in communication, their application in various contexts, and the principles that govern their design. We will also discuss their role in the Workplace Hazardous Materials Information System (WHMIS) and the Globally Harmonized System of Classification and Labelling of Chemicals (GHS) in Canada, and how they aid in communicating critical information about hazardous products.
Whether you’re a designer keen to grasp the principles of pictogram design, a communication professional intrigued by non-verbal communication systems, or simply curious about the symbols that punctuate our daily lives, this article promises to be an enlightening read. So, let’s embark on this journey to explore the captivating world of pictograms.
History of Pictograms
Pictograms, also known as pictographs or pictogrammes, are graphic symbols that convey meaning through their pictorial resemblance to physical objects. They have been used throughout human history as a means of communication, dating back to ancient civilizations
The earliest known pictograms were used in Mesopotamia, predating the famous Sumerian cuneiforms, which date back to around 3400 BCE.
These early pictograms were used on tokens placed on farm produce as early as 9000 BCE. As civilization advanced and cities developed, more complex pictographs were devised and used on labels for manufactured goods. In addition to Mesopotamia, pictograms were also used by ancient Chinese culture since around 5000 BCE and began to develop into logographic writing systems around 2000 BCE.
Pictogram usage can also be found in other ancient civilizations, such as the Aztec, Mayan, and other South American empires. The Sumerian cuneiform script, which emerged around 3000 BCE, is considered the earliest known writing system. It developed from pictographs and other symbols used to represent trade goods and livestock on clay tablets. The script was used to write several languages, including Sumerian, Akkadian, Babylonian, Assyrian, Elamite, Hittite, Urartian, and Old Persian.

The Babylonian language used the cuneiform writing system, which originated with the Sumerians around 3400 BCE and was later adapted by various cultures, including the Babylonians. Cuneiform consists of wedge-shaped marks and was used for several ancient Near Eastern languages. This image is a tablet that is part of the collection at Louvre-Lens, written in Babylonian cuneiform. It’s a poem depicting a dialogue between a man and his god, originating from Mesopotamia (modern-day Iraq), dating between 1800 and 1600 BC. The photograph of the tablet was taken during the inauguration of Louvre-Lens on December 4, 2012, showcasing the historical significance and artistic expression of cuneiform writing.
Over time, pictograms evolved and became more abstract, eventually giving rise to more advanced writing systems such as hieroglyphs in ancient Egypt and cuneiform in Mesopotamia As written and spoken languages began to converge and develop into more phonetic and literal meanings, the usage of pictograms diminished.
In modern times, pictograms have found new applications in various contexts, such as data visualization, signage, and non-verbal communication They continue to play an essential role in communication, especially in situations where language barriers or accessibility issues are present.
Versatile Usage of Pictograms
Pictograms, the graphic images that communicate meaning through their resemblance to physical objects, find usage in diverse contexts such as data visualization, signage, and non-verbal communication.
In data visualization, pictograms serve as a potent tool. They find application in infographics, reports, presentations, and even resumes. Pictogram charts, also known as isotype charts, encode numeric data using repeated icons, with each icon representing a fixed quantity. This approach makes categories immediately legible and aids readers in comprehending large numbers by fragmenting them into more digestible units. They are visually memorable and can effectively illustrate ratings or changes, indicate progress towards a goal, add flair to a simple bar chart, and summarize survey results.
In the realm of signage, pictograms swiftly communicate information, offer interactivity, and simplify complex ideas. They are ubiquitous in various contexts such as websites, product UIs, signage, events, and merchandise. In the context of ADA signs, pictograms assist the visually impaired. Pictograms can be categorized into three types: required, recommended, and optional. Required pictograms are essential on signs that aid people with disabilities, such as wheelchair accessible restrooms and disabled parking spaces. Recommended pictograms are advised on signs that identify permanent rooms and spaces, such as restrooms. Optional pictograms can be used on all other signs, such as elevator signs or no smoking signs.
In non-verbal communication, pictograms offer an alternative communication method for individuals who struggle with spoken language. For instance, they can be used to communicate with aphasia patients, who have difficulty expressing their needs in spoken language. A non-verbal communication system that utilizes pictograms can facilitate interactive communication between non-disabled individuals and individuals with disabilities, adults and children, and people from different cultures.
In the context of the Workplace Hazardous Materials Information System (WHMIS) and the Globally Harmonized System of Classification and Labelling of Chemicals (GHS) in Canada, pictograms are employed to indicate the type of hazard present in a hazardous product. They are displayed on product supplier labels and safety data sheets. In the medical field, a study found that incorporating pictograms on medicine labels can enhance patient understanding and adherence.
Design Principles of Pictograms
Designing effective pictograms involves adhering to several key principles, including simplicity, clarity, and scalability. These principles ensure that pictograms are easily recognizable, visually appealing, and adaptable to various contexts and sizes.
Simplicity
Simplicity is crucial in pictogram design, as it ensures that the symbols are easily understood and quickly processed by the viewer. To achieve simplicity, designers should use only the most essential elements and avoid unnecessary details or visual metaphors. This approach makes pictograms more accessible and easier to comprehend, even for users who may not be familiar with the specific concept or object being represented.
Clarity
Clarity is another vital aspect of pictogram design. Pictograms should be easily recognizable and convey their intended meaning without ambiguity. To achieve clarity, designers should focus on creating symbols that are visually distinct and easy to identify. This may involve using simple shapes, clear outlines, and familiar visual cues that resonate with users’ previous experiences or standard conventions.
Scalability
Scalability is an important consideration in pictogram design, as it ensures that the symbols can be easily adapted and resized without distortion, pixelation, or loss of quality. Designers should create pictograms that maintain their visual clarity and recognizability at various sizes, making them suitable for different applications and devices. IBM, for example, offers two types of pictograms: productive and expressive
Productive pictograms feature simple linework and are suitable for most contexts, while expressive pictograms are more dynamic and visually impactful, making them ideal for specific use cases. Both types of pictograms share similar design guidelines, with the exception of stroke specifications and color application. IBM pictograms are drawn on a 32px x 32px base grid, which helps ensure consistency and scalability across different symbols
In summary, designing effective pictograms involves focusing on simplicity, clarity, and scalability. By adhering to these principles, designers can create visually appealing and easily recognizable symbols that enhance communication and user experience.
Pictograms in Different Industries
Pictograms, by visually representing concepts, play an essential role across various industries, bridging communication gaps and enhancing information accessibility. Here’s how they are utilized in healthcare, transportation, and technology sectors:
Healthcare
In the healthcare sector, pictograms are instrumental in communicating critical medical information. They are used on medicine labels, patient instructions, and healthcare signage. For instance, standardized pictograms have been developed by the United States Pharmacopeia (USP) to ensure the clarity of medical instructions and to enhance patient understanding and adherence (Source: USP Pictograms).
Transportation
In transportation, pictograms guide travelers and manage traffic through universally recognizable symbols. These symbols are meticulously designed to be understood quickly by individuals from diverse linguistic backgrounds. For instance, the International Air Transport Association (IATA) has set standardized pictograms for airport signage, enabling passengers to navigate airports across the globe without language barriers (Source: IATA Signage).
Technology
In technology, pictograms or icons are a core component of user interface (UI) design. They are used to symbolize functions and features, enhancing user experience and intuitiveness. The International Organization for Standardization (ISO) has guidelines for computer icons in user systems to ensure consistency and comprehensibility (Source: ISO/IEC 11581).
Creating Pictograms
Designing and validating pictograms is a complex process that demands careful consideration to ensure that they effectively communicate the intended information.
Design Process
- Identify Purpose and Audience: Understanding the specific context and target audience helps in defining the message and selecting relevant symbols.
- Create Initial Design: The designer sketches the symbol, maintaining simplicity, clarity, and scalability.
- Test for Transparency: The design is evaluated to ensure that the symbol conveys the intended meaning without ambiguity.
- Refine and Modify: Based on feedback and testing, the pictogram is refined to eliminate confusion and enhance recognition.
Validation
- Involve Target Audience: The target audience is engaged to assess the pictogram’s transparency and to understand if the symbol effectively communicates the intended message.
- Test for Translucency: Testing for translucency ensures that the pictogram conveys more complex meanings, specific to a particular context, without losing its primary transparent meaning.
- Iterative Review: The design undergoes several rounds of review and testing, allowing for adjustments to optimize comprehensibility and effectiveness.
Examples and Standards
Standards such as ISO 7001 (“Public information symbols”) provide guidelines for the design and validation of pictograms, ensuring that they meet international criteria for usability (Source: ISO 7001).
In summary, creating effective pictograms involves an intricate process of design and validation, aligning with international standards, and ensuring that the symbols serve their intended purpose in a clear and effective manner. By leveraging these symbols across diverse industries like healthcare, transportation, and technology, pictograms bridge communication gaps, enhance user experience, and facilitate safety and understanding.
Pictograms and Accessibility
Pictograms serve as an inclusive form of communication, breaking down barriers and reaching wide-ranging audiences, including individuals with disabilities and those facing language barriers. Their role in enhancing accessibility is highlighted in the following contexts:
Disabilities
Pictograms provide alternative ways of communication for those with speech, cognitive, or sensory disabilities. Symbols like Makaton combine signs, symbols, and speech to help individuals with communication difficulties (Source: Makaton).
Language Barriers
For non-native speakers and people encountering unfamiliar languages, pictograms offer a universal form of understanding. They are utilized in public transportation, airports, and hospitals to guide individuals without depending on verbal instructions.
Educational Support
In education, pictograms are used to support literacy development and provide visual cues to children with learning disabilities, facilitating comprehension and engagement.
Digital Inclusion
In the digital world, pictograms enhance web accessibility, making information digestible for users with different abilities and preferences.
Regulations and Guidelines
Organizations like the World Health Organization (WHO) recommend using pictograms to make health information more accessible (Source: WHO Guidelines). Laws like the Americans with Disabilities Act (ADA) guide the use of pictograms in public spaces to ensure accessibility (Source: ADA Standards).
In summary, pictograms act as powerful tools to bridge communication gaps, offering a versatile and inclusive means of conveying information that caters to a wide demographic, regardless of language proficiency or physical ability.
Usage of Pictograms in GHS Labels
In the context of safety, especially in relation to chemicals and hazardous materials, pictograms serve a vital role in the Globally Harmonized System of Classification and Labelling of Chemicals (GHS). Pictograms in GHS labels are standardized symbols used to communicate specific hazards associated with various chemicals. Here’s an in-depth look at their usage, importance, and design:
Function and Importance
GHS pictograms are specifically designed to provide instant recognition of the hazards associated with chemicals, thus helping to protect workers and the public who might come in contact with these substances. The primary function of these pictograms is to convey essential safety information in a universally understandable manner, ensuring that language barriers and literacy levels do not hinder comprehension.
Design and Symbols
The GHS has identified nine distinct pictograms, each representing a different class of hazard. These pictograms are diamond-shaped, with a distinctive black symbol on a white background, enclosed within a red border. The symbols are designed to be simple and intuitive, making them easily recognizable.
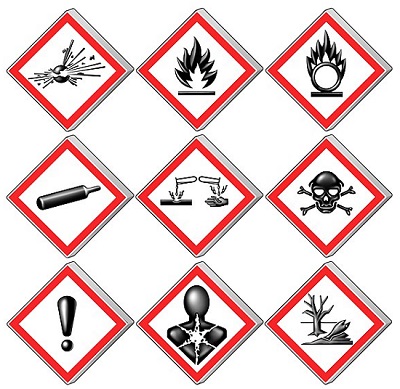
Here’s a brief overview of the nine GHS pictograms:
- Health Hazard: Indicates chemicals that may cause health problems, such as carcinogens, respiratory sensitizers, reproductive toxicity, etc.
- Flame: Represents flammable materials, including gases, aerosols, and liquids.
- Exclamation Mark: Warns of acute toxicity, skin irritation, eye irritation, etc.
- Gas Cylinder: Signifies gases under pressure, such as compressed, liquefied, or dissolved gas.
- Corrosion: Identifies substances that can cause skin burns, eye damage, or corrosion to metals.
- Exploding Bomb: Indicates explosive materials.
- Flame over Circle: Represents oxidizers that can cause or intensify a fire.
- Environment (non-mandatory): Symbolizes environmental hazards, such as aquatic toxicity.
- Skull and Crossbones: Warns of acute toxicity that can be fatal or harmful if swallowed, inhaled, or enters the skin.
Implementation and Compliance
The implementation of GHS pictograms is globally harmonized, ensuring consistency in hazard communication across countries and industries. Compliance with the GHS standards is often mandatory and governed by regulations, and failure to adhere to these guidelines may result in legal consequences. In the United States, for instance, the Occupational Safety and Health Administration (OSHA) oversees the enforcement of GHS regulations (OSHA Guidelines for Hazard Communication).
GHS pictograms play a pivotal role in the safety and handling of chemicals by providing visual cues that quickly and effectively convey hazard information. The standardized design and widespread implementation ensure that safety instructions are consistently communicated, regardless of language or region. In a workplace environment, proper understanding and use of GHS pictograms contribute to enhanced safety and compliance with international regulations.
Conclusion
Pictograms, as visual symbols representing ideas and concepts, have transcended mere artistic expression to become a vital part of our daily communication. Rooted in ancient civilizations, their evolution through time reflects humanity’s innate drive to visualize and symbolize thoughts and emotions.
In today’s globalized world, pictograms serve as a universal language, cutting across linguistic barriers and cultural divides. They are essential in industries such as healthcare, transportation, and technology, where they simplify complex information, ensuring clarity and consistency.
Their significance in enhancing accessibility cannot be understated, as they offer a lifeline to those with disabilities and language barriers, fostering inclusivity and understanding.
Whether through facilitating safety in hazardous environments, enhancing patient adherence in healthcare, or simplifying navigation in public spaces, pictograms continue to resonate as a versatile, powerful tool of communication.
Their design and validation require a nuanced understanding of human cognition and perception, guided by principles of simplicity, clarity, and scalability.
In a world increasingly driven by visual cues, pictograms stand as a testament to the power of imagery in communication. Their continued relevance and growing application underscore their role as not just symbols but as a language, connecting, informing, and empowering people across the globe.
References:
- https://www.ibm.com/design/language/iconography/pictograms/design/
- The design, understanding and usage of pictograms C. Tijus, J. Barcenilla, J. Meunier. Published 2005
- https://en.wikipedia.org/wiki/Pictogram
- https://www.newworldencyclopedia.org/entry/Pictogram
- https://www.omniglot.com/writing/sumerian.htm
- Khan Academy article on Cuneiform
- https://en.wikipedia.org/wiki/Cuneiform
- Image Reference for GHS Labels